Standard Operating Procedures
Tier 1
1. What is the color palette for this project?
| Source | Process |
|---|---|
| If Client Has Provided A Styling Guide | Pull colors from the styling guide and populate the colors in the output table. |
| else if Client Has Provided A Logo? | Color Generation Guide |
| else use Intellivega Default Colors | Intellivega Default Colors Are Defined In The Output Table |
| else select primary color manually | Color Generation Guide |
Color Generation Guide
If you have an image
- Navigate To Adobe Color
- Upload Image
- Select Primary Color
- Navigate To Color Wheel
- Select Complementary In The Apply Color Harmony Rule
- Input Primary Color Into C
- E Will Become The Secondary Color
- A Will Become The Tertiary Color
If you do not have an image
- Navigate To Adobe Color
- Select Complementary In The Apply Color Harmony Rule
- Input Primary Color Into C
- E Will Become The Secondary Color
- A Will Become The Tertiary Color
Video Walkthrough
2. What is the Font Style for this project?
| Source | Process |
|---|---|
| If Client Has Provided A Styling Guide | Pull font styles from the styling guide and populate the colors in the output table. |
| else if Client Has Provided A Website? |
|
| else use Intellivega Font Style | Intellivega Font Style Are Defined In The Output Table |
Video Walkthrough
3. Project Output
| Select Color Option | Description | Color |
|---|---|---|
| Colors | ||
| Primary | This will be the main color you use throughout your design of the file. If the client has a style guide, use their provided colors for this and the next few steps. If not, use their website to determine their prefered colors. If no website, use their logo to determine a good match. There are websites you will use to extract color from an image/logo | #00733C |
| Secondary | This will be the secondary color used for highlighting areas and making them stand out in your visual design | #BF1378 |
| Tertiary | This will be used primarilly for links and other important areas of your text and design that are not as prominent | #733306 |
| White | You may need an off-white that is not the standard white. Capture what you will use. | #FFFFF9 |
| Black | You may need an dark Grey that is not a standard black. Note this. | #00331A |
| Standard Font | ||
| Font Style | The standard font that *most content* in the workbook will be utilizing | Franklin Gothic Book |
Best Practices
What To Avoid
1. Create Data Entry Template Sheet
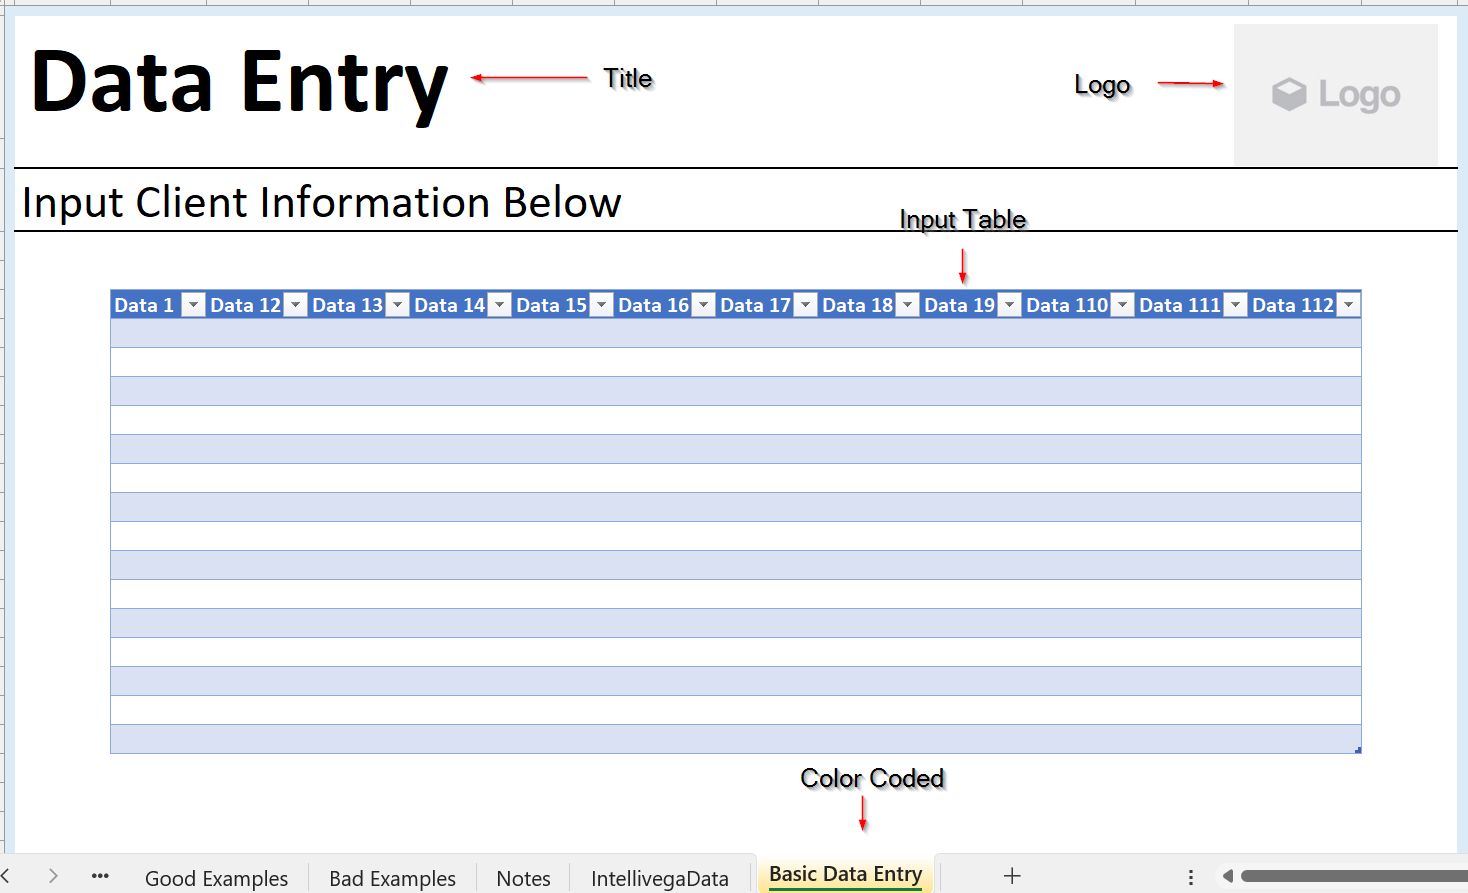
Data Entry tabs are any tab a user manually enter data. These tabs should have a logo and header, make use of the colors and fonts choosen above, and have an awareness to the need to focus on making capturing the data easy.
- A. Page Header With Branding
- B. Color code tab so the end user knows these sheet are the primary place to input data
- C. Ttable with data headers complete with relevant entry fields
- D. Logo for client branding
- Use of Font & Color Selections
This is an example of the placement of content and should not be interpreted as the required styling format for a data entry screen.

2. Create Reporting Template Sheet
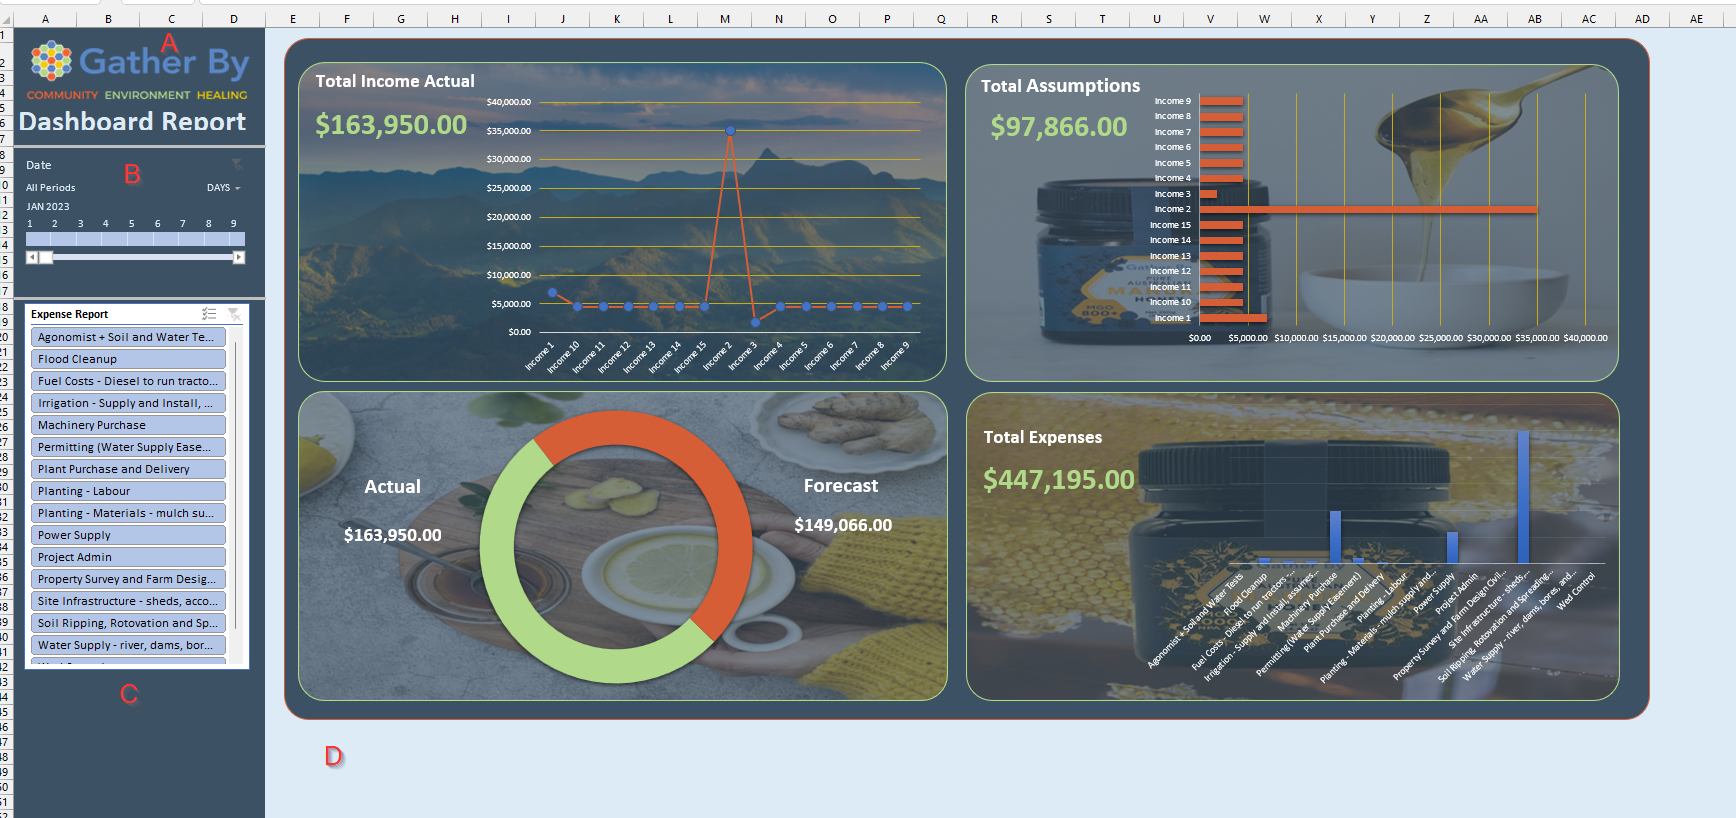
Reporting is any tab a user will go to gather info. It usually consists of calculations that pull data from the data entry screens. Logos and branding can be more prominent here as the goal of reports and dashboards are to "show off" the data and the brand to stakeholders.
- A. Page Header With Branding
- B. Date Filter
- C. Diminesion Filters / Slicers
- D. Visualization Area
- *Use of Font & Color Selections
This is an example of the placement of content and should not be interpreted as the required styling format for a reporting entry screen.

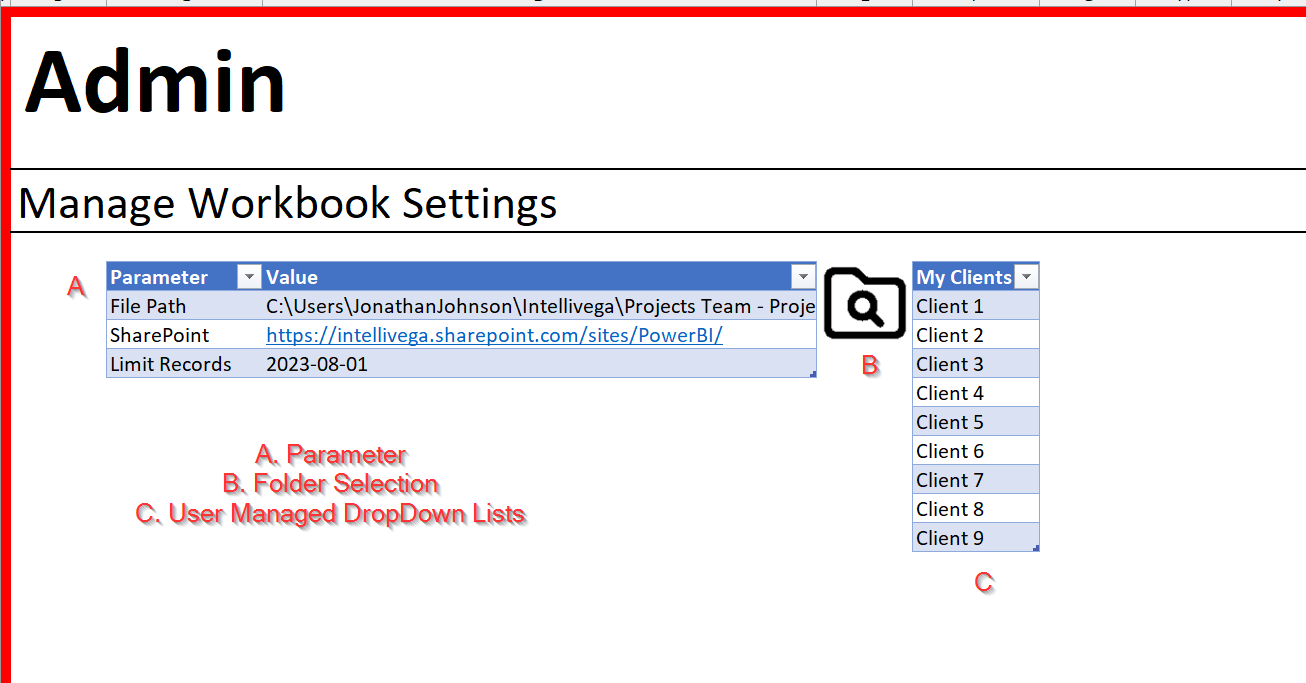
1. Admin Worksheet
The IntellCalcs page will store measures and the calculated drop down list. This may not be the only place for measure depending on the reporting requirements but should be included as standard. The format should be as follows:
Requirements
- User Driven Drop Downs
- Parameter Tables (If Applicable)
- File / Folder Path Selections
Example

1. IntellCalcs Worksheet
The IntellCalcs page will store measures and the calculated drop down list. This may not be the only place for measure depending on the reporting requirements but should be included as standard. The format should be as follows:
Requirements
- Require For KPI / Measure Results
- Required For Dropdowns
Example

2. Drop Downs
- Must Be Sorted
- Must Be Unique
- Must Be Proper Case
- Must Remove Duplicates
- Must "All"" Option In DropDown List For Report/Dashboard
- All Dropdowns Should Be Om IntellCalcs Worksheet
Video Walkthrough
Important!
This section will outline the standard method for creating drop downs for entry forms and reporting. This process will introduce the new worksheet "IntellCalcs" into our template.
1. Standard Entry Form Worksheet
- Be Table Object
- Have Proper Headers
- Clean Clear Titles
- Table Must Be Named
Video Walkthrough
2. Standard Calculations
Calculations should be included and hidden in every manual entry for unless we are doing them in Power Query when applicable.
Requirements
- Clearly Named Columns
- Black Header With White Text
- Hidden From View
Commonly Used
-
Date
-
Start of Month:
EOMONTH([Date],-1)+1 - End of Month:
EOMONTH([Date],0) - Weekending:
[Date]+8-WEEKDAY([Date]) - Year:
Year([Date]) - Weekday Name:
TEXT([Date],"DDDD")
-
Start of Month:
-
String Functions
-
Look Ups Functions
-
Vlookup
VLOOKUP(lookup value, range containing the lookup value, the column number in the range containing the return value, optionally specify TRUE for approximate match or FALSE for an exact match) -
Hlookup
HLOOKUP(lookup_value, table_array, row_index_num, [range_lookup]) - Xlookup
XLOOKUP(lookup_value, lookup_array, return_array, [if_not_found], [match_mode], [search_mode]) - Index
INDEX(array, row_num, [column_num]) - Match
MATCH(lookup_value, lookup_array, [match_type]) - Index With Match
[Date]+8-WEEKDAY([Date])
-
Vlookup
-
IF Functions
-
IFS Functions
-
IFS
IFS([Something is True1, Value if True1,Something is True2,Value if True2,Something is True3,Value if True3) -
SUMIFS
SUMIFS(sum_range, criteria_range1, criteria1, [criteria_range2, criteria2], ...) -
AVERAGEIFS
AVERAGEIFS(average_range, criteria_range1, criteria1, [criteria_range2, criteria2], ...)
-
IFS
3. Include Calculation
- Uniue Include Per View
- Required Process
Video Walkthrough
1. Advanced Entry Form
Process
- Download Intellivega 2019 Excel Toolbar
- Enable "Trust access to the VBA project object model" in Macro Settings
Video Walkthrough
1. Creating Parameter Table
Best Practice!
This is a best practice for loading parameters into Power Query that eliminates the firewall error that can occur during other processes
Process
- 1. Create Parameter Table On Admin Worksheet
-
2. Create fnGetParameter in Power Query
                                                            (ParameterName as text) =>

                                                            let

                                                            ParamSource = Excel.CurrentWorkbook(){[Name="tblParameters"]}[Content],

                                                            ParamRow = Table.SelectRows(ParamSource, each ([Parameter] = ParameterName)),

                                                            Value=

                                                            if Table.IsEmpty(ParamRow)=true

                                                            then null

                                                            else Record.Field(ParamRow{0},"Value")

                                                            in

                                                            Value
- 3. How To Call fnGetParameter
-
4. Recommended Parameters
- File Path
- SharePoint
- Limit Records
Video Walkthrough
2. Hot Swapping Datasets
Best Practice!
This is a best practice for improving the loading speed of data when using sharepoint by using the local file system in place of the sharepoint during developement. This process makes it easy to change which dataset is being loaded but it's important that the sharepoint is used when delivering to the client. The unused dataset should also be disable for delivery.
Process
- 1. Create File Path Load Query
- 2. Create Sharepoint Load Query
- 3. Create Dataset for Process
- 4. Ensure Sharepoint Connection Is Used When Delivering To Client
- 5. Disable Local File When Delivering To Client
Video Walkthrough
3. Filtering Data
Best Practice!
This is a best practice for improving the loading speed of data when using database by limiting the amount of data that is pulled in during the development process. This process makes it easy to change the limit of what is being loaded but it's important that the limit set appropriately when delivering to the client.
Process
- 1. Limit Parameter
- 2. Load SQL Tablke
-
3. Add Limit Filter To SQL
                                                            let

                                                            mysql = if fnGetParameter("Limit Records")="" then "Select * From ProjectUpdates" else "Select * From ProjectUpdates Where CreatedOn >='" & fnGetParameter("Limit Records") & "'",

                                                            Source = Sql.Database("mysql.intellivega.com", "intelliv_Ampv3", [Query=mysql])

                                                            in

                                                            Source
Video Walkthrough
4. Remove Blank
Process
- 1. Load Into Power Query
- 2. Remove Blank Rows
- 3. Tranpose
- 4. Remove Blank Rows
- 5. Transpose
Video Walkthrough
5. Data Cleaning
Know This!
Garbage In Ensures Garbage Out! Having Quality Data is better than having fancy algorithms.
Data Cleaning Challenge
Data Cleaning Considerations
- 1. Data Strategy: What are the data errors? What is causing the data errors?
- 2. Can Identified Issues Be Corrected At Source?
- 3. Manage Duplicates
- 4. Append Missing Data
- 5. Clean Strings (If Applicable)
- 6. Set Data Types Zip Code Should Strings
- 7. Standarize Formats
- 8. Remove Errors
- 9. Remove Blanks
Video Walkthrough
1. Create Table Styles
Requirements
- Create a visual style for the table that will look nice with in the reporting template that has been designed.
2. Create Pivot Table Styles
Requirements
- Create a visual style for the pivot tables that will look nice with in the reporting template that has been designed.
3. Create Slicer Styles
Requirements
- Create a visual style for the slicers that will look nice with in the reporting template that has been designed.
4. Create Chart Styles
Requirements
- Create a visual style for the chart that will look nice with in the reporting template that has been designed.